Components
Charts

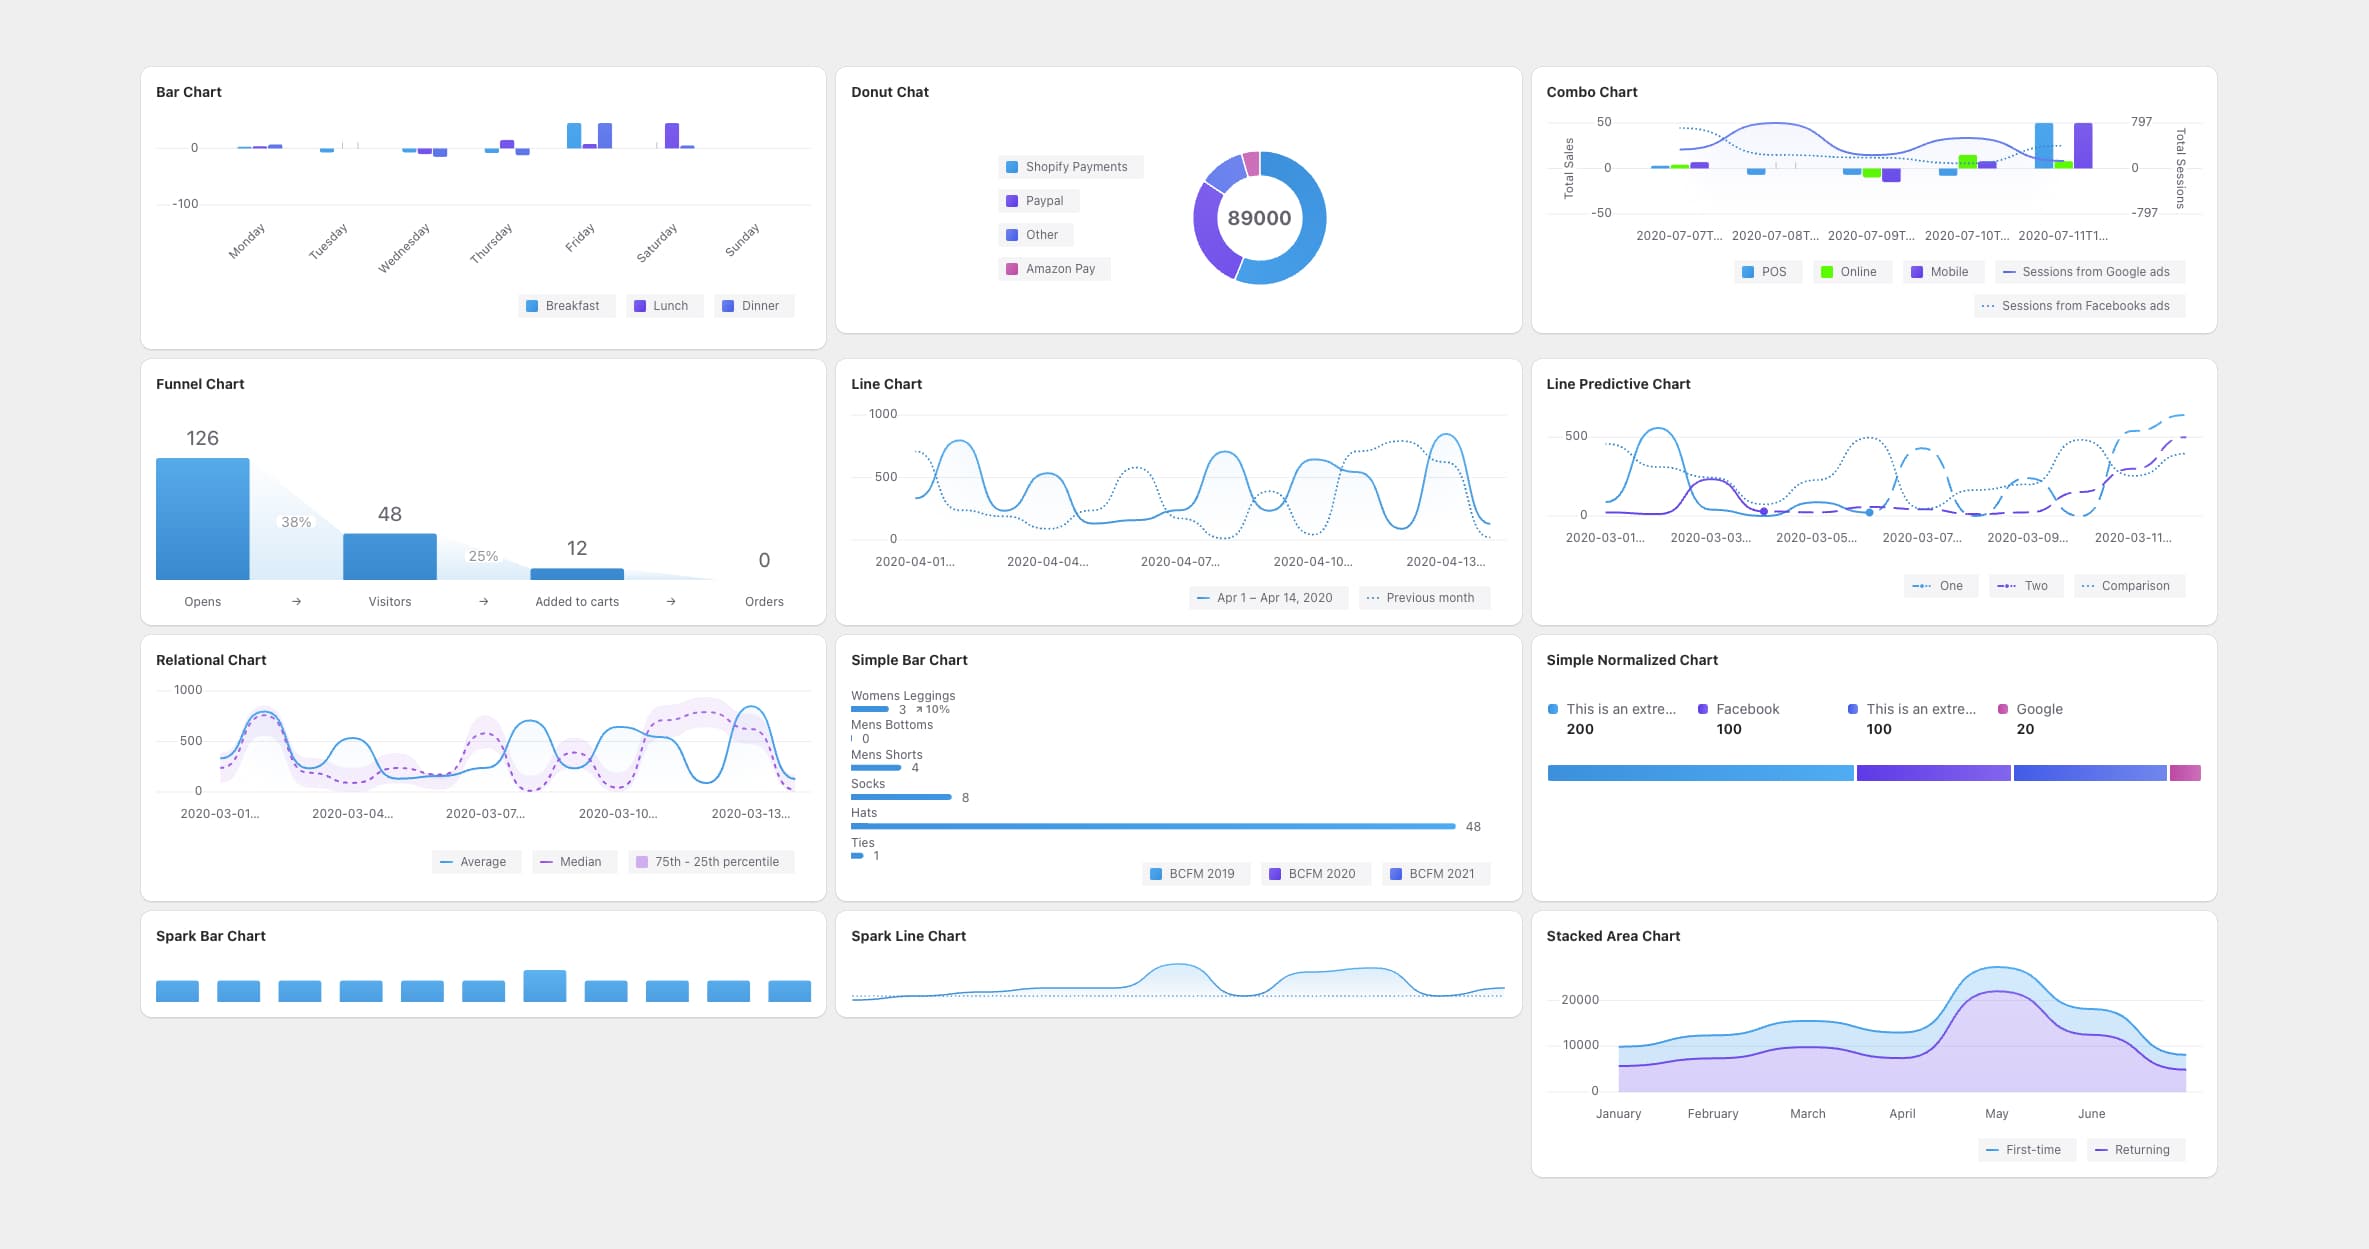
The charts functionality is implemented using polaris-viz, wrapped in ready-to-use components for seamless integration into your application. To get started, import the desired chart component from /components/charts. You can refer to the demo page at pages/charts to see all available charts with example data.
Quick Start
Here's an example using the Line Chart component:
import LineChart from "../components/charts/LineChart"

const LINE_CHART_DEMO_DATA = [
  {
    name: "Apr 1 – Apr 14, 2024",
    data: [
      { value: 333, key: "2024-04-01T12:00:00" },
      { value: 797, key: "2024-04-02T12:00:00" },
      { value: 234, key: "2024-04-03T12:00:00" },
      { value: 534, key: "2024-04-04T12:00:00" },
      { value: 132, key: "2024-04-05T12:00:00" },
      { value: 159, key: "2024-04-06T12:00:00" },
      { value: 239, key: "2024-04-07T12:00:00" },
    ],
  },
  {
    name: "Previous month",
    data: [
      { value: 709, key: "2024-03-02T12:00:00" },
      { value: 238, key: "2024-03-01T12:00:00" },
      { value: 190, key: "2024-03-03T12:00:00" },
      { value: 90, key: "2024-03-04T12:00:00" },
      { value: 237, key: "2024-03-05T12:00:00" },
      { value: 580, key: "2024-03-07T12:00:00" },
      { value: 172, key: "2024-03-06T12:00:00" },
    ],
    color: "red",
    isComparison: true,
  },
]

function MyComponent() {
  return <LineChart title="Line Chart" data={LINE_CHART_DEMO_DATA} />
}
Additional Resources
For more detailed information about the charting library, refer to:
